
Industry

Rules of thumb out of people's heads, live with whoever needs them

Your installations, your orders and your planning in one hub. That way you see exceptions while you can still adjust course.

Sound familiar?

The real knowledge is on the shop floor, not in your systems

  • The real knowledge sits in the heads of a few experienced operators. A new colleague needs months.
  • Installations have been built step by step: machine controllers (PLCs) and SCADA from different generations and brands.
  • Production data is separate from orders, planning and maintenance.
  • Improvement projects end in a report afterwards, while the difference is made on the shop floor.
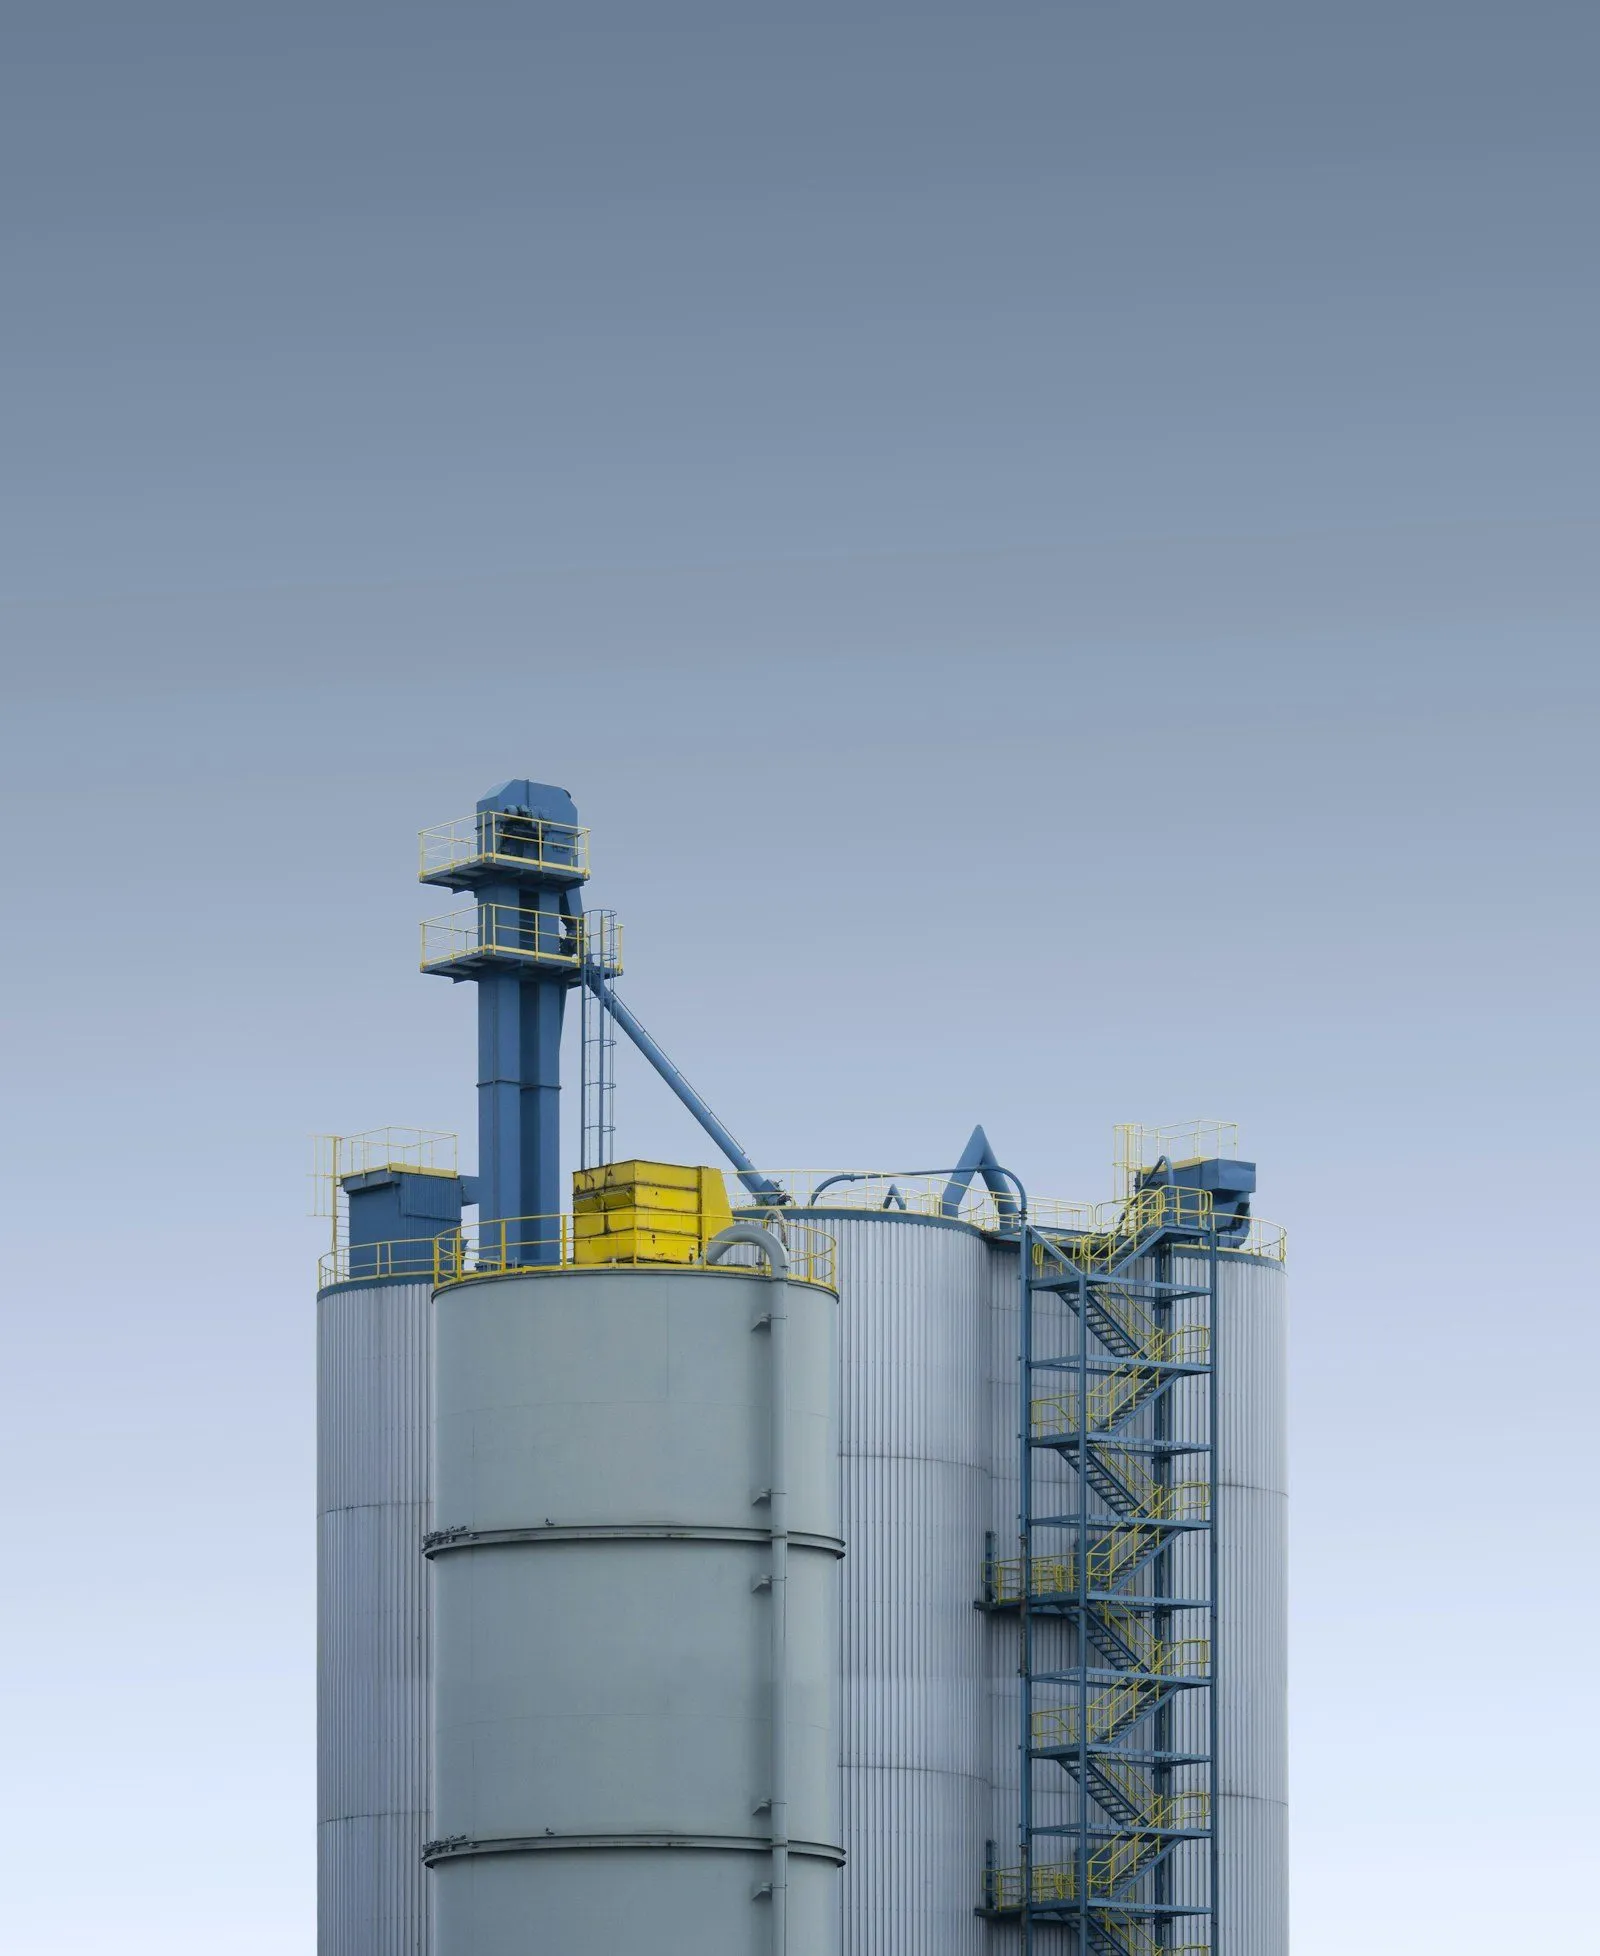
Industrial silos with an elevator and stairs

Belgian cement plant: live insights, also for untrained operators

Captains of Logic brings measurement data together and shows the crane operators on site whether conditions are right to unload a ship. Every new crane operator knows what is expected of them without training.
What it delivered

  • The rules of thumb are always applied correctly.
  • The domain knowledge is captured in a system.
  • A new crane operator knows what is expected of them without training.
Read the customer case
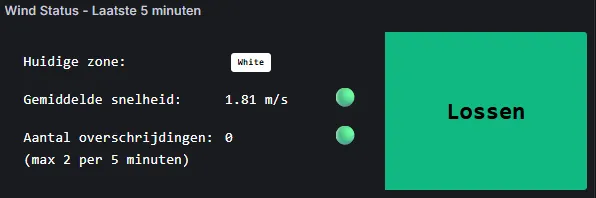
Operator screen with the wind status of the last five minutes and the Unload signal
The operator's screen: the wind status of the last five minutes and straight away the signal whether unloading can go ahead.
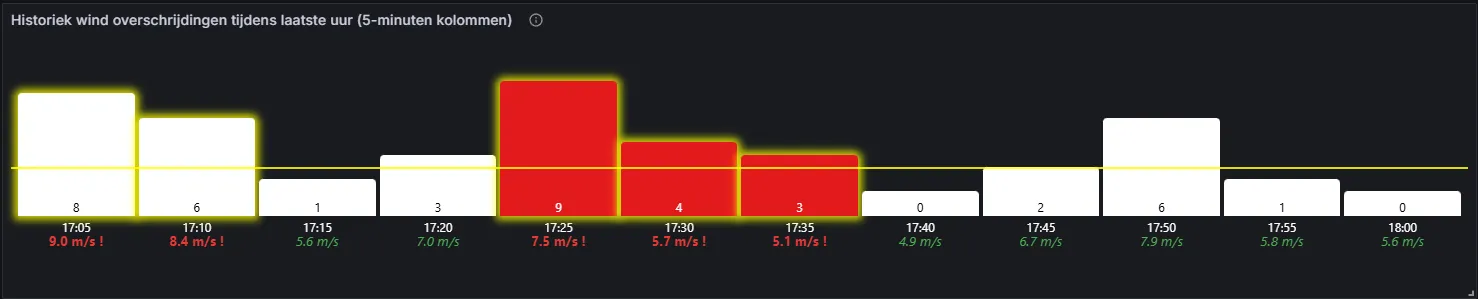
Dashboard with the wind exceedances of the past hour, per five minutes

What you can do with it

Applications in industry

What the customer case shows can work for you too: bringing together the knowledge of your experienced people and the data of your installations live. Every application starts from systems you already have.

  1. Phase 1All your data in one place, queryable with AI
  2. Phase 2Evaluate the past period with KPIs
  3. Phase 3Adjust course while it still matters

Machine data alongside orders and planning

Measurements from your installations and transactions from your ERP or MES come together in one hub, with one name and context per machine, line or order.

Diagram phase 1: connectors pull the data from your systems into one data hub, which you query with the AI subscription you already have.Insights for youquestions in plain language, with theAI subscription you already haveData hubuser permissionsdata modelConnectorsYour systemsHR, finance, TMS, WMS, planning,PLC, SCADA, telematics …

Works with

  • PLC
  • SCADA
  • ERP
  • MES
Situation
When there is a deviation on the line, nobody knows immediately which order and which customer are affected. That information is in another system.
What the hub does
Connectors pull the data from the machine controller, from SCADA and from your ERP or MES. In the hub, everything gets a fixed name and context. This way of working is called a unified namespace.
What you gain
When there is a deviation, you see immediately which order and which customer are affected. Quick diagnosis across systems.

Older installations in the picture too

Installations from different generations and brands are connected, without replacing them.

Industrial silos with an elevator and stairs

Works with

  • PLC
  • SCADA
  • existing monitoring
Situation
Alongside new lines, older installations are running, each with its own control and monitoring. They stay out of the picture.
What the hub does
For every data source, we find a way to get the data out, whatever the brand or year of construction. You do not need your own IT department. We coordinate with the suppliers of software solutions and sensor systems. Every system that handles data is a potential source that we connect.
What you gain
One view across all your installations, old and new. No large migration.

KPIs and OEE across lines and generations

The same key figures for old and new installations, so that improvement projects rest on facts.

Diagram phase 2: KPI dashboards sit on top of the data hub, a slow loop to evaluate the past period and adjust course.Insights for youquestions in plain language, with theAI subscription you already haveData hubuser permissionsdata modelConnectorsYour systemsHR, finance, TMS, WMS, planning,PLC, SCADA, telematics …KPIdashboardsslowloop

Works with

  • PLC
  • SCADA
  • ERP
  • Power BI
Situation
Each line measures differently. Comparing OEE, the key figure for availability, performance and quality of an installation, across lines is a calculation exercise in Excel.
What the hub does
On the combined data we build targeted KPI dashboards with the same definitions for every line. Your BI tool can use the data from the hub.
What you gain
You evaluate the past period on facts and adjust course for the next. One reliable overall picture for the managing director or operations manager.

Evaluate deviations with the history

When you evaluate a deviation, you find in one place which changes happened when in process, orders and planning.

Diagram: timeline with changes from different systems (orders, master data, planning), each with a timestamp08:14Orderschange10:02Master datachange13:37Planningchange

Works with

  • all connected systems
Situation
A deviation keeps coming back. To find the cause, the quality department gathers data from different systems.
What the hub does
All data is stored in the hub with a timestamp. That way you see which changes happened when, including those made by an AI agent, alongside the process data of that moment.
What you gain
Finding the cause in one place, without gathering data together. A basis for tackling recurring deviations structurally.

Flag exceptions live

If a process parameter deviates or an order falls behind schedule, the right person gets a notification while they can still adjust course.

Diagram phase 3: agents and algorithms follow the data hub live, a fast loop that adjusts course while it still matters.Insights for youquestions in plain language, with theAI subscription you already haveData hubuser permissionsdata modelConnectorsYour systemsHR, finance, TMS, WMS, planning,PLC, SCADA, telematics …KPIdashboardsslowloopAgents andalgorithmsfastloop

Works with

  • PLC
  • SCADA
  • MES
  • ERP
  • planning
Situation
A deviation only surfaces in the end-of-week report, when the damage has already been done.
What the hub does
Algorithms follow the data stream live and flag what needs attention. Who gets which notification, we agree per project. At first your team approves every proposal. Only after a validation period, and only where possible and where we activate it together with you, can an algorithm intervene automatically.
What you gain
You adjust course during production, not afterwards. You stay in control.

Works with what you already have

The systems we bring together

Whatever the brand or generation. We replace nothing.

  • PLC
  • SCADA
  • MES
  • ERP
  • planning
  • maintenance management
  • quality registration
  • external measurement networks
  • and the other systems you use
Operational data hub

Other sectors

In other sectors too

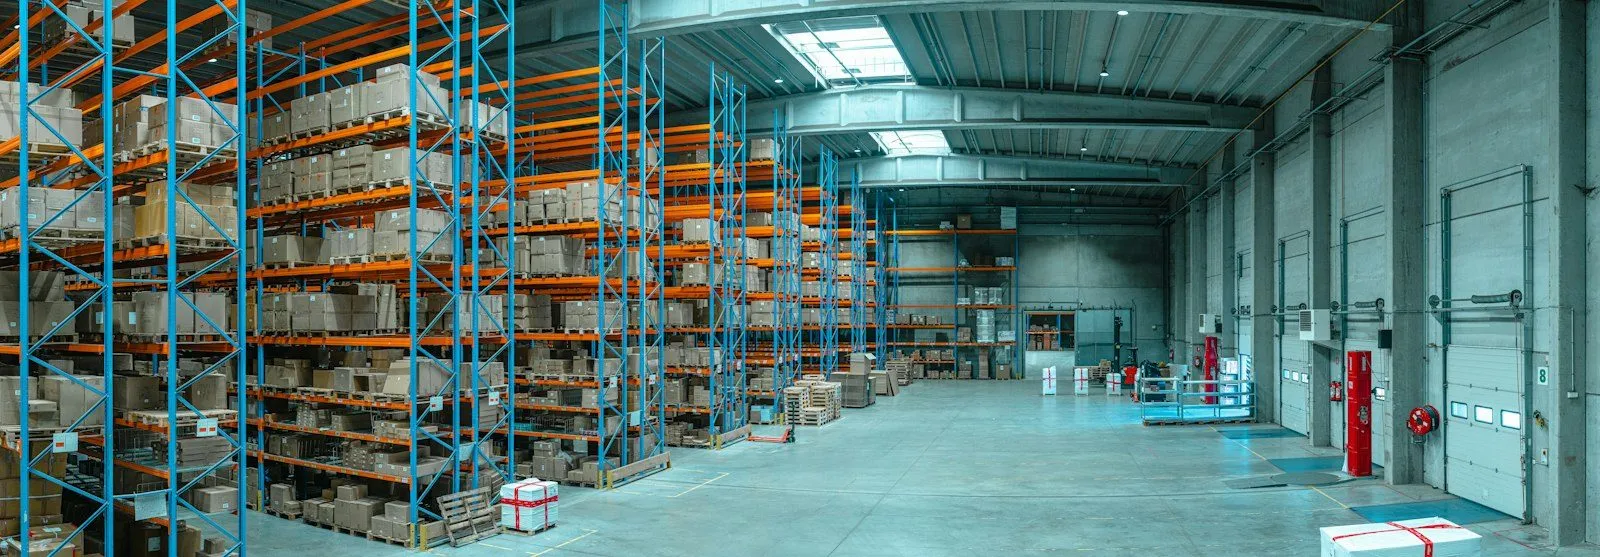
Warehouse with high racking

Logistics

Your TMS, WMS and tracking together, with a notification at the moment it still matters.

View logistics
Offshore wind turbines

Energy

One view across all your installations, instead of ten logins.

View energy

Next step

Shall we work out your first application together?

A worked-out Proof of Value lets you make a well-founded decision.

Book an exploratory call (opens in a new tab)

Prefer to call or email right away? Pieter Langsweirdt · +32 498 516 440 · pieter@captainsoflogic.com