Energy

One view across all your installations, instead of ten logins

Solar panels, batteries, charging points, heat pumps or wind turbines, whatever the brand or year of construction. We bring their data together with your planning, your maintenance and your contracts.

Sound familiar?

Every new park brings yet another portal

  • Every acquired park or new contract brings yet another portal. One view takes a round of a dozen systems every morning.
  • Installations have been built step by step: different brands, technologies and years of construction, each with its own monitoring. That history does not make it easy to optimise the whole.
  • You only see a fault when someone opens the right portal.
  • The installation data is separate from your planning, your technicians and your contracts.
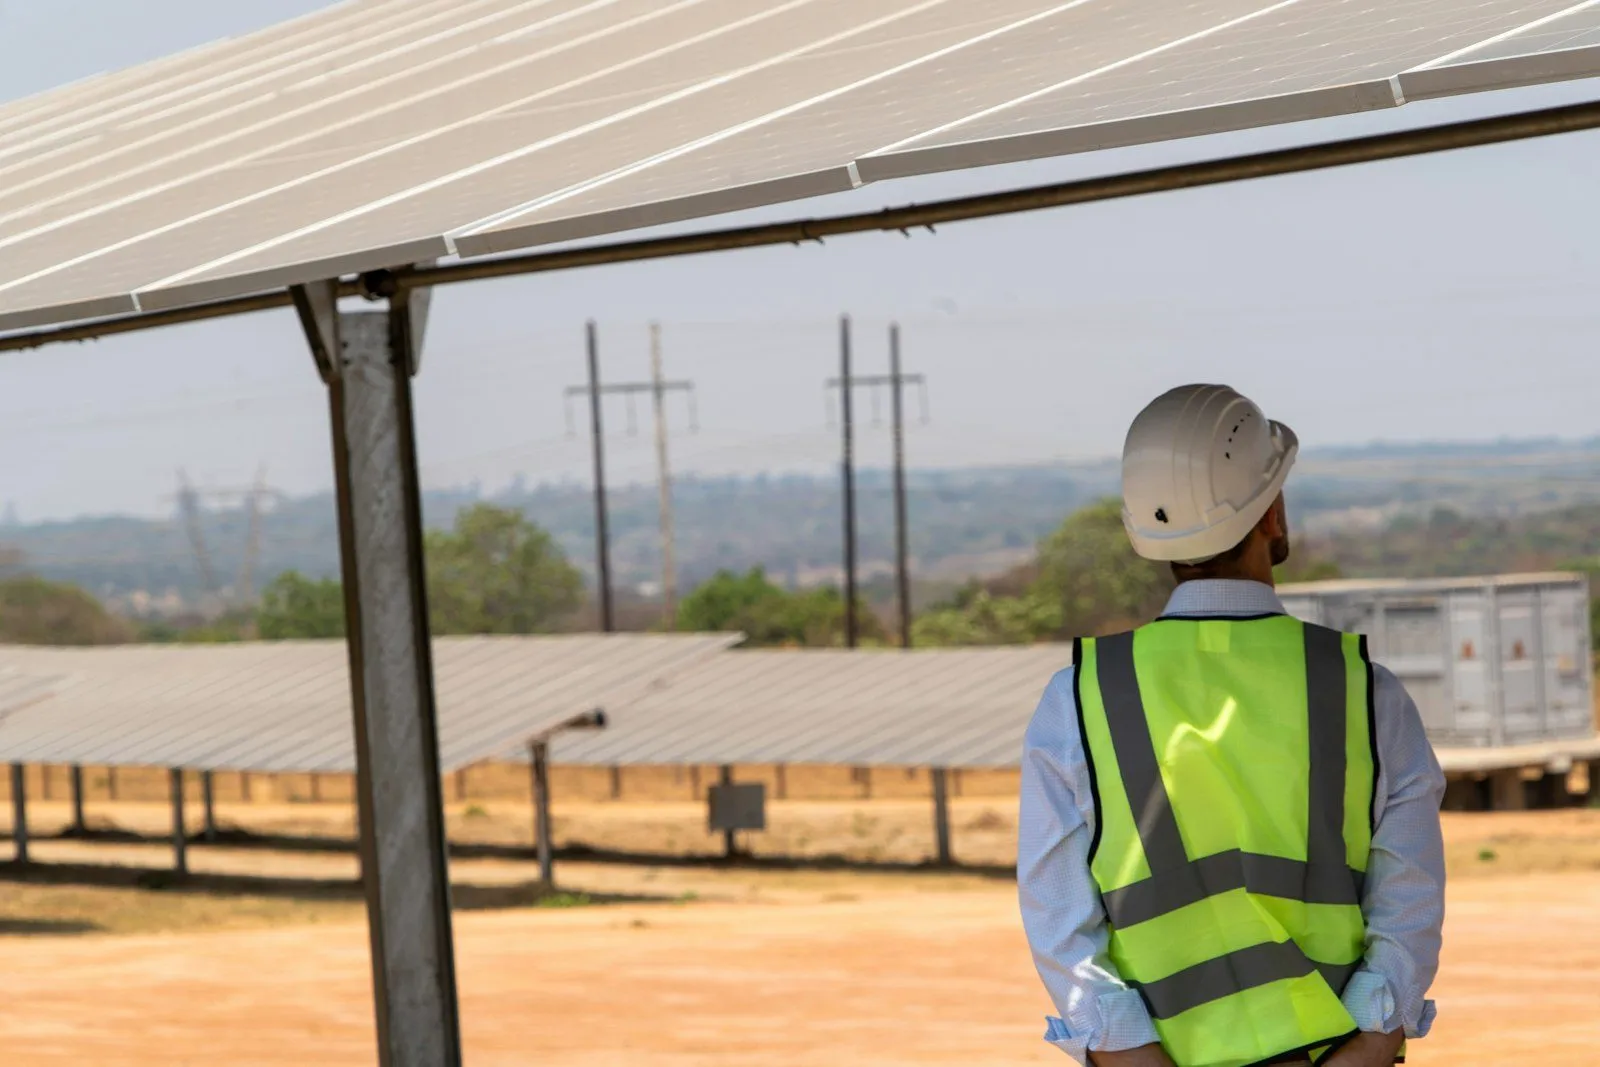
Technician with a helmet and high-visibility vest in a solar park

Belgian energy supplier: reliable and optimal control of flexible assets

As a balance responsible party, every wrong control action costs money. Captains of Logic builds the architecture for secure, stable and fast integration of assets for flexible control.

Situation
The customer is an energy supplier and balance responsible party (BRP) on the Belgian energy grid. It is working on connecting flexible assets to its network.
What Captains of Logic does
The Captains of Logic team advises on and builds the architecture and the connectors for secure, stable and fast integration of assets for flexible control. The data hub is used for monitoring and controlling the energy assets.
Next: comparing assets Phase 1Phase 2
For this customer, control came first. Once all assets are connected, you can ask which asset performs better (phase 1) and measure and visualise performance in a dashboard thanks to the unified namespace (phase 2).
Control, with you at the helm
Control belongs to phase 3. Automatic control only happens after a validation period and in consultation.
How phase 3 works
Diagram: flexible assets enter the data hub via connectors, for monitoring and controlMonitoringControlData hubConnectorsFlexible assets

What you can do with it

Applications in energy

For those who maintain, manage or build energy installations. Every application starts from the portals and systems you already have.

  1. Phase 1All your data in one place, queryable with AI
  2. Phase 2Evaluate the past period with KPIs
  3. Phase 3Adjust course while it still matters

One view across all portals

The data from every monitoring portal comes together in one hub, with one name and context per installation, regardless of brand or year of construction.

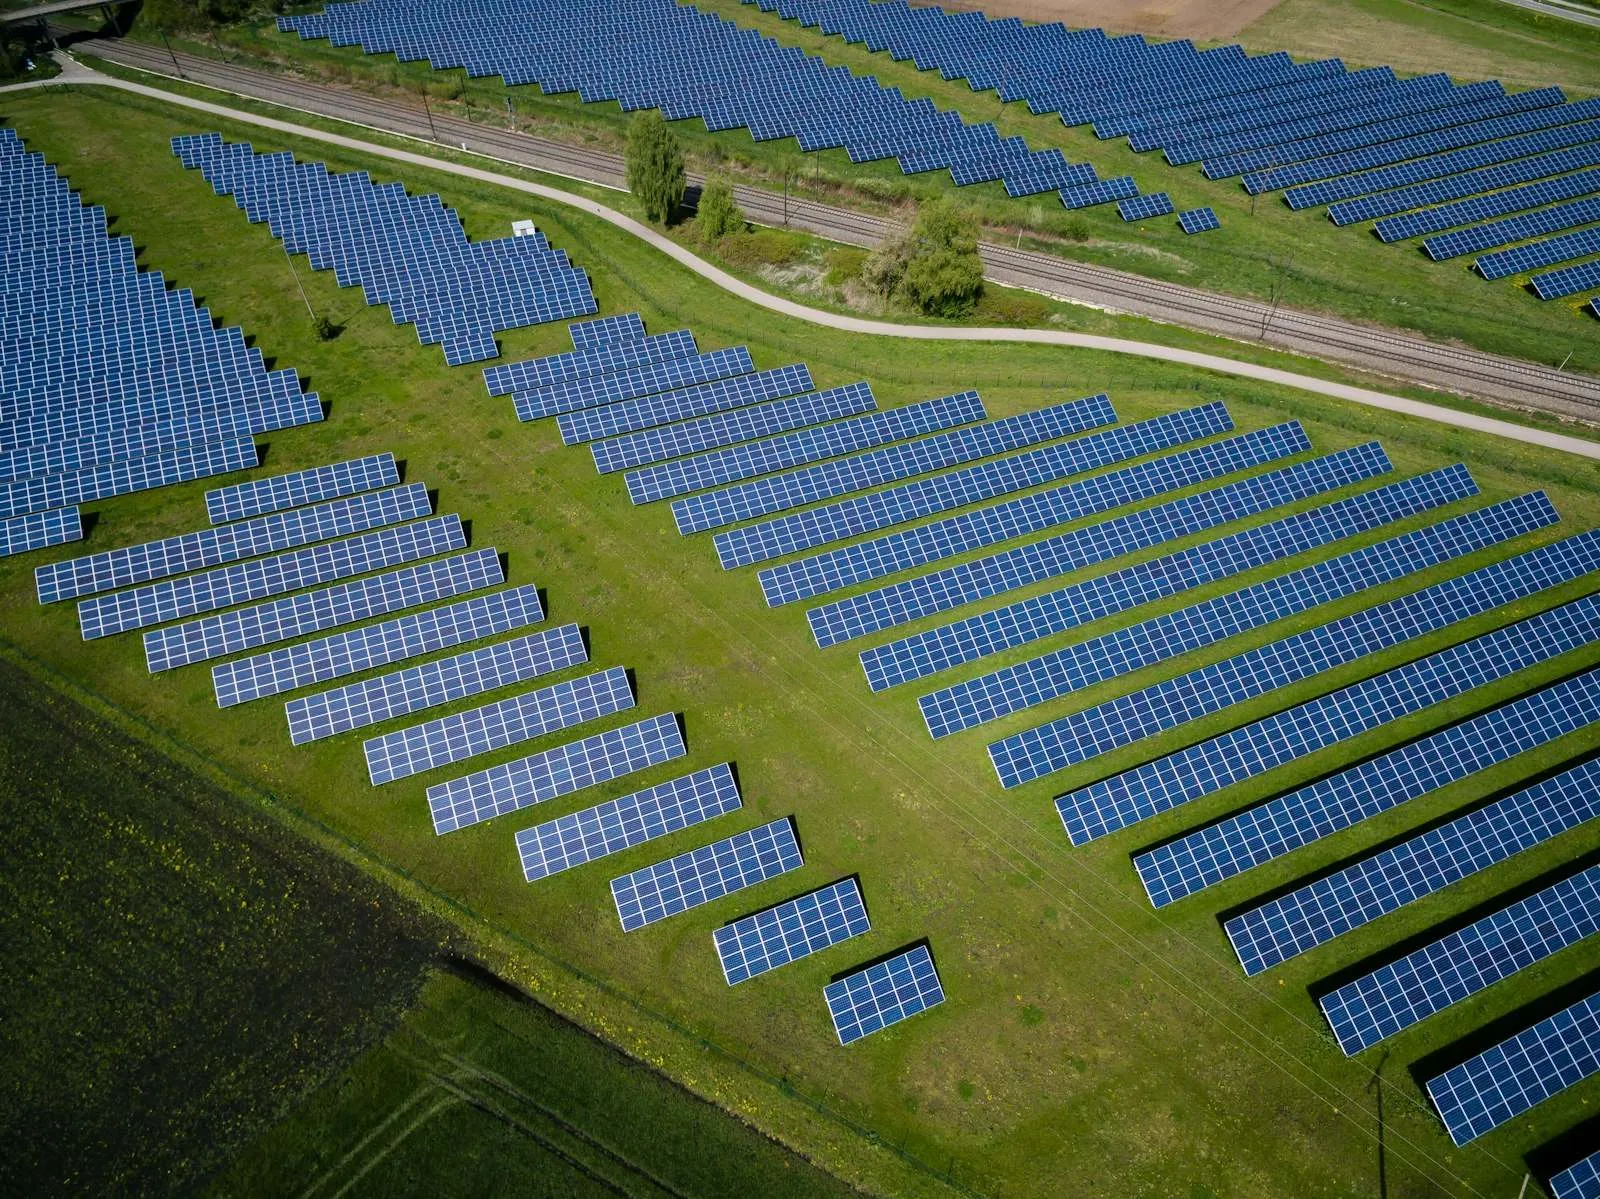
Solar park seen from above

Works with

  • monitoring portals
  • inverters
  • energy meters
  • SCADA
Situation
You inherit installations from installers and project developers, and with them their portals. Every morning someone logs in to a dozen systems to get one view.
What the hub does
One connector per portal retrieves the data. In the hub, every item gets a fixed name and context, so installations from different brands become comparable. This way of working is called a unified namespace.
What you gain
One screen instead of ten logins. You also set up uniform notifications for all assets, including those added in the future.

Ask questions about your whole park

You ask in plain language which installations performed below expectations. Overall Equipment Effectiveness (OEE) becomes a conversation that directly yields the right conclusions.

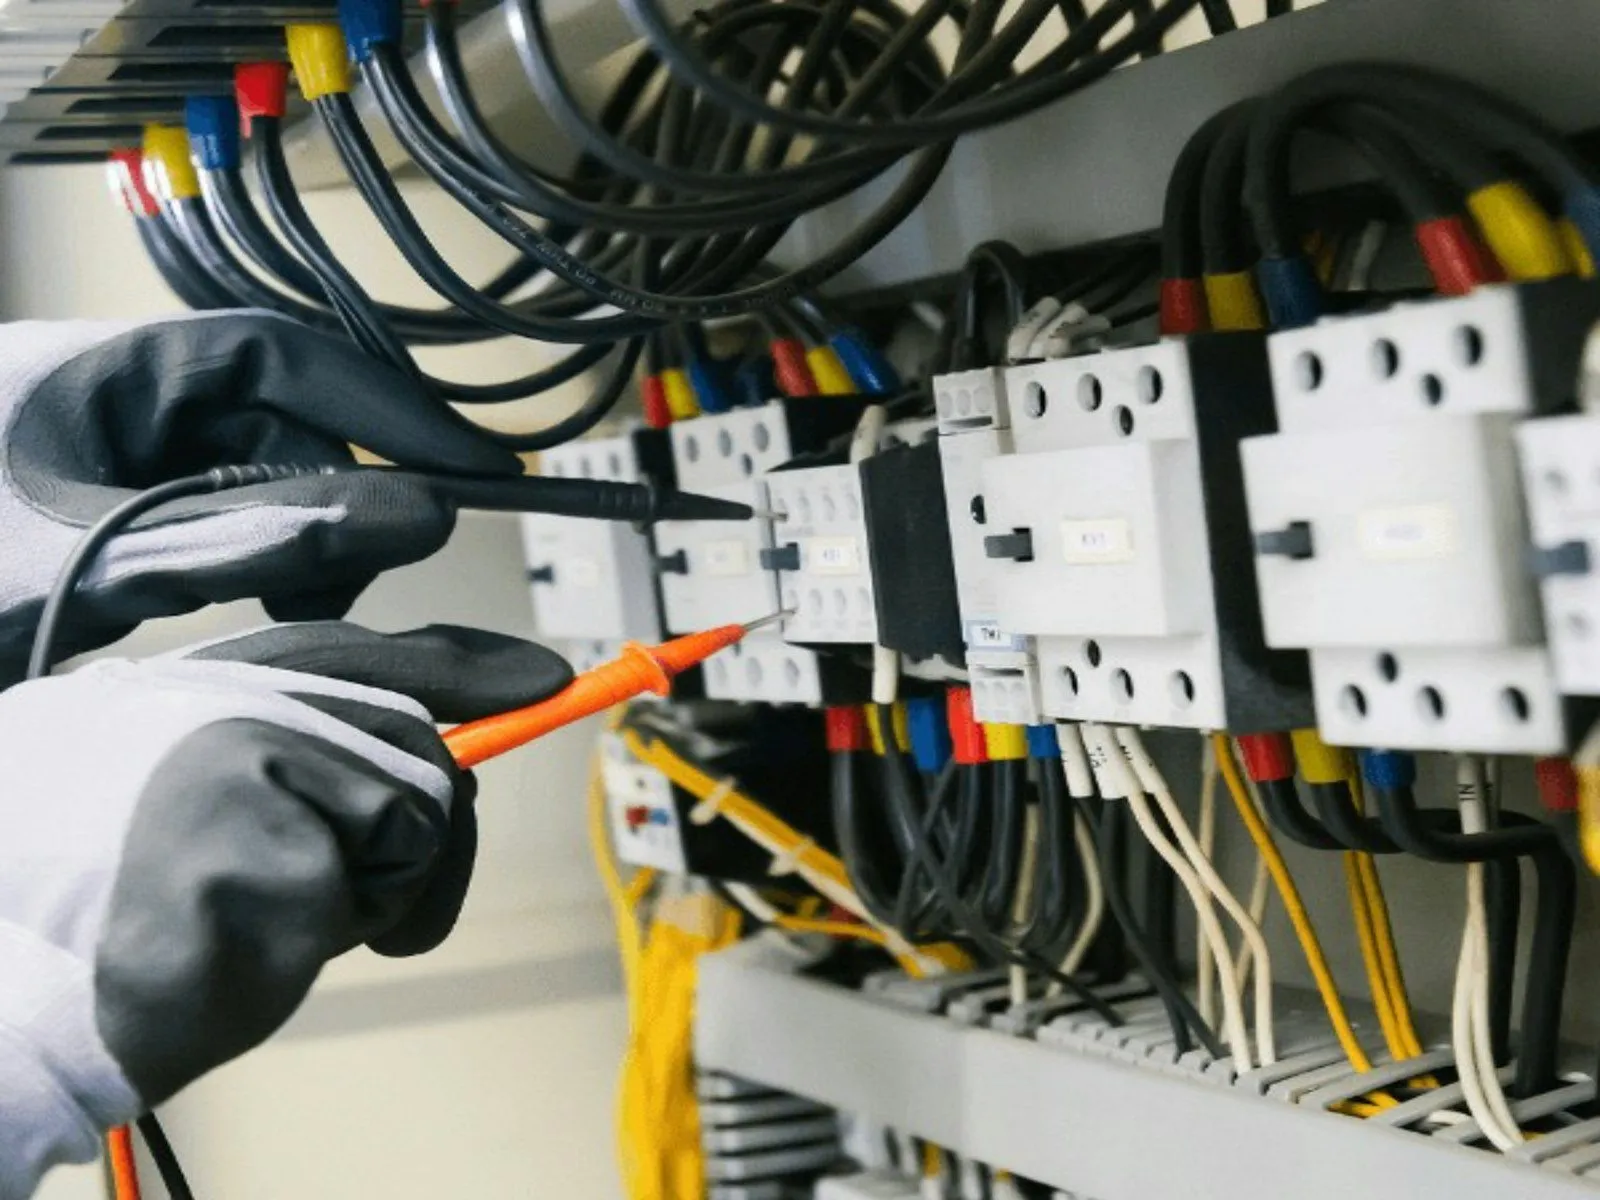
Measurement with a multimeter in a switch cabinet

Works with

  • monitoring portals
  • maintenance management
Situation
Production, faults and interventions are in different portals and lists. Answering a question about the whole park takes a lot of searching.
What the hub does
The hub stores the current and historical data of all portals and of your maintenance data. You ask your question with the AI subscription you already have.
What you gain
A quick diagnosis across all your installations. Decisions based on all the facts.

Planning, technicians and invoicing in the same view

Not just your installations, but also your technicians, your planning and your invoicing come together in one hub.

Technician with a helmet and high-visibility vest in a solar park

Works with

  • monitoring portals
  • planning
  • HR
  • finance
  • contract management
Situation
A monitoring platform shows the installations. But who does which intervention, what the contract says and what has been invoiced is somewhere else.
What the hub does
The hub brings the installation data together with your planning, your staff data, your contracts and your invoicing. That is how a data hub differs from a monitoring platform that only shows installations.
What you gain
One overall picture of your operation, not just of your installations. For example, you see the operational improvement after a maintenance job or intervention.

One reporting layer across all technologies

The same KPIs for every installation and every park, across brands and technologies.

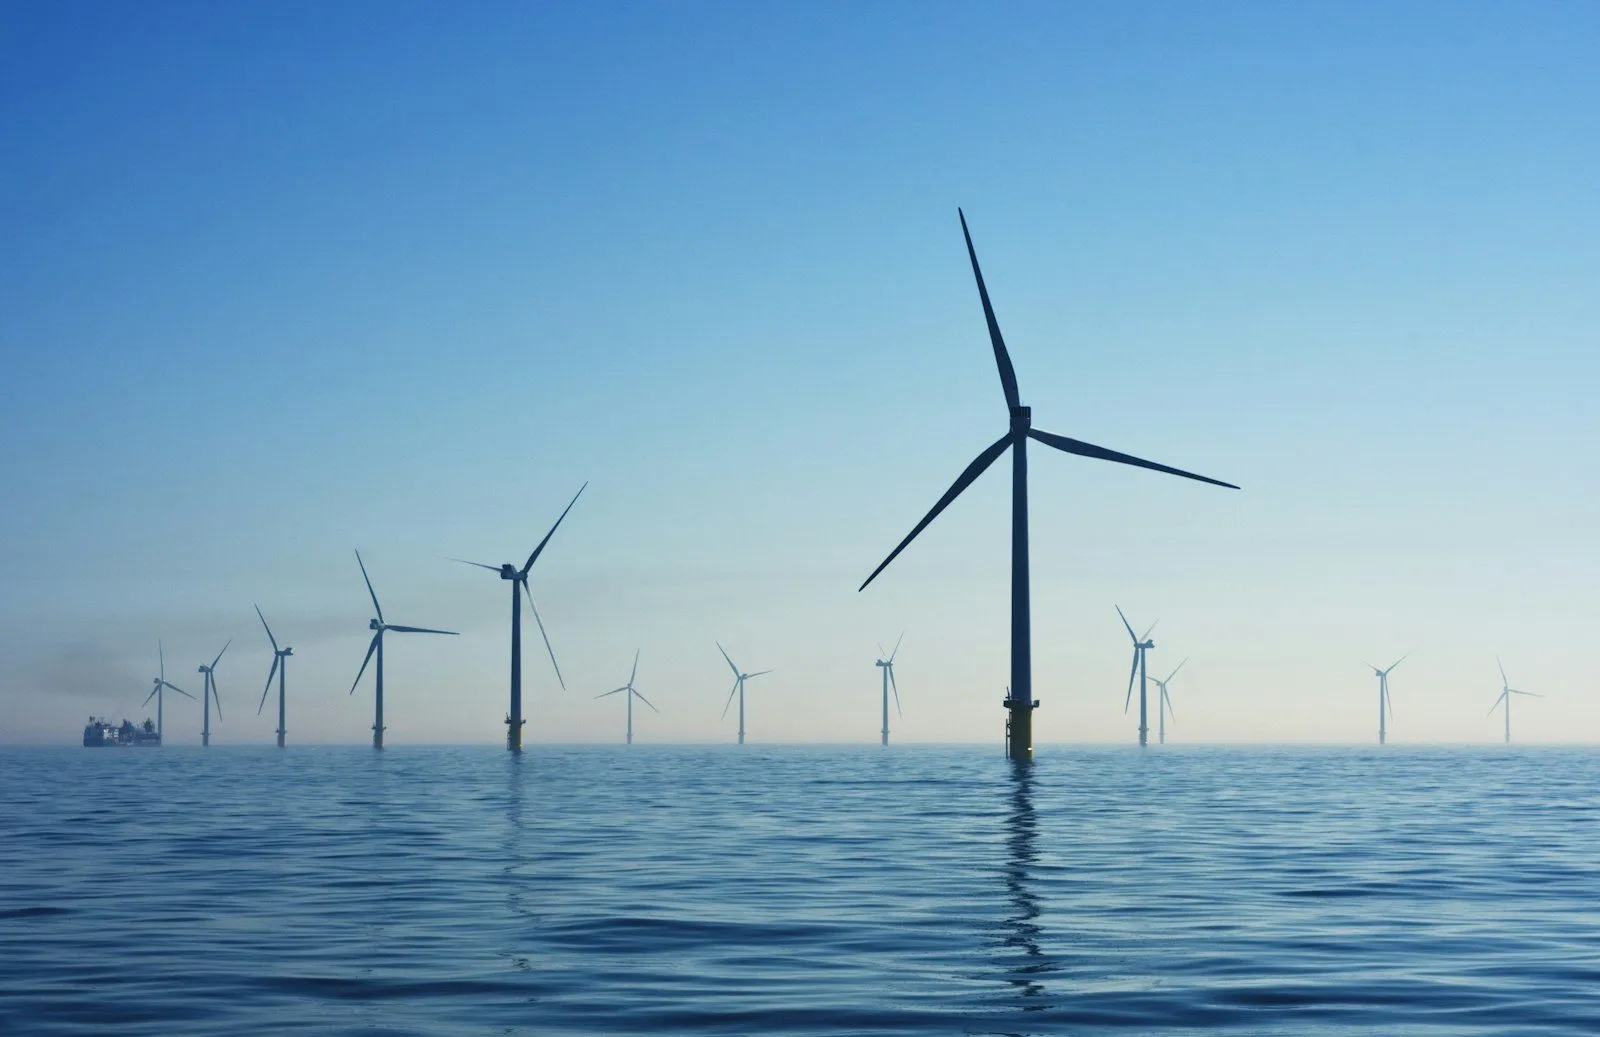
Offshore wind turbines

Works with

  • monitoring portals
  • energy meters
  • Power BI
Situation
Each portal reports in its own way. Comparing production, consumption and availability across parks is manual work.
What the hub does
On the combined data we build targeted KPI dashboards per period, for your own follow-up and for reporting to the owners of the installations. Your BI tool can use the data from the hub.
What you gain
You evaluate the past period on facts. You get one reliable overall picture across technologies. Uniform notifications make prioritising simple.

Faults reported without logging in first

If an installation fails or deviates, the right person gets a notification, without anyone first having to open the right portal.

Works with

  • monitoring portals
  • planning
Situation
A fault goes unnoticed until someone happens to open the right portal.
What the hub does
Algorithms follow the data of all installations live. In the event of a failure or deviation, a notification goes to whoever needs to know. Who gets which notification, we agree with you per project.
What you gain
You see a fault when it occurs, not afterwards. You adjust course while it still matters.

From fault to intervention proposal

A fault signal and the intervention planning together give your planner a proposal, which they approve themselves first.

Diagram: fault signal and planning come together in the data hub, which shows a proposal on the planner's screen with an approve buttonFault signalPlanningData hubPlanner's screenProposalapprove

Works with

  • monitoring portals
  • maintenance management
  • planning
Situation
After a fault, the planner has to work out themselves which technician is available, what is already scheduled and what the contract provides for.
What the hub does
An agent places the fault signal alongside the planning and the maintenance history and proposes an intervention. The planner approves every proposal themselves.
What you gain
Your planner can bundle and prioritise interventions based on live data. You stay at the helm yourself.

Works with what you already have

The systems we bring together

Whatever the brand or year of construction. Your portals stay; we get the data out of them.

  • inverter and monitoring portals
  • SCADA
  • energy meters
  • charging point management
  • maintenance and planning software
  • contract management
  • HR
  • finance
  • and the other systems you use
Operational data hub

Other sectors

In other sectors too

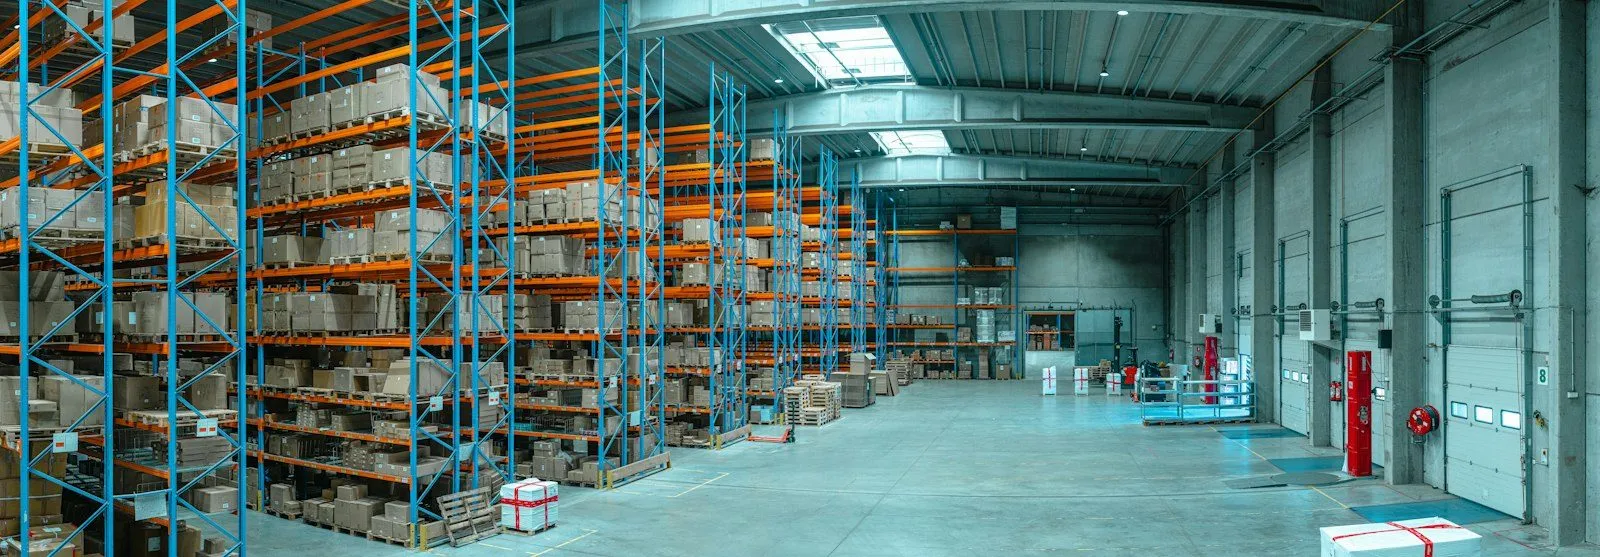
Warehouse with high racking

Logistics

Your TMS, WMS and tracking together, with a notification at the moment it still matters.

View logistics
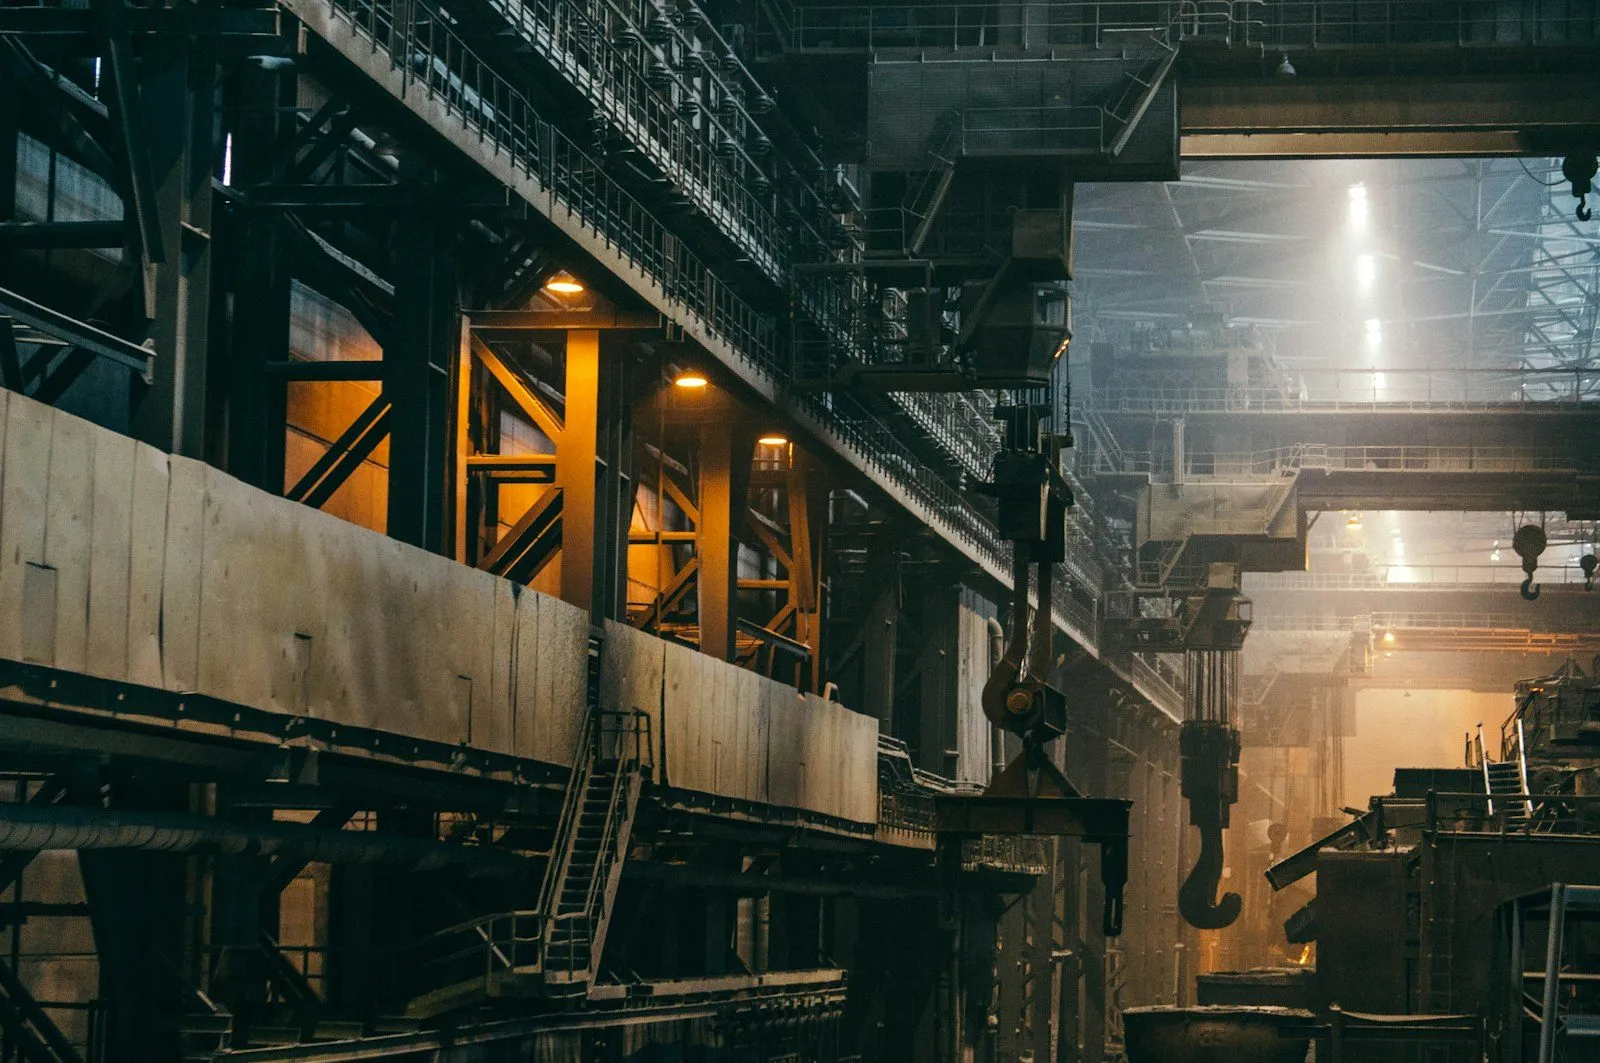
Interior of a heavy industrial hall

Industry

Rules of thumb out of people's heads, live with whoever needs them.

View industry

Next step

Shall we work out your first application together?

A worked-out Proof of Value lets you make a well-founded decision.

Book an exploratory call (opens in a new tab)

Prefer to call or email right away? Pieter Langsweirdt · +32 498 516 440 · pieter@captainsoflogic.com