Applications

One data hub. Many applications.

Every application starts from data you may already have today.

Customer cases

Customer cases

Belgian energy supplier: reliable and optimal control of flexible assets

As a balance responsible party, every wrong control action costs money. Captains of Logic builds the architecture for safe, stable and fast integration of assets for flexible control.

Diagram: flexible assets enter the data hub via connectors, for monitoring and controlMonitoringControlData hubConnectorsFlexible assets

Belgian cement plant: live insights, even for untrained operators

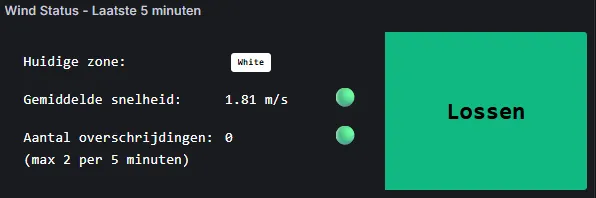
Captains of Logic brings measurement data together and shows the crane operators on site whether conditions are right to unload a ship. Every new crane operator knows, without training, what is expected of them.

Operator screen showing the wind status over the last five minutes and the Unload signal

Inspiration

Applications by sector and phase

Click a card to see the situation, what the hub does and what you gain.

Show applications for

Sector
Phase

Phase 1: all your data in one place, queryable with AI. Phase 2: evaluating the past period with KPIs. Phase 3: adjusting course while it still counts.

Logistics

One question, all your systems

You ask one question in plain language across TMS, WMS, fleet and telematics together.

Works with

  • TMS
  • WMS
  • fleet management
  • telematics
  • HR
  • accounting
Situation
If you want to know which trips were delayed last month and where the delay arose, someone has to gather data from three or four systems.
What the hub does
Connectors pull the data from each system. In the hub, every data point gets a fixed name and context, so that a trip in the TMS and the same trip in the telematics belong together. You ask your question with the AI subscription you already have.
What you gain
One place to ask questions. A fast diagnosis when something goes wrong. Analyses of your processes the moment the question arises.

Discrepancies between TMS and WMS stand out

Discrepancies caused by double entry stand out before they affect the planning or the invoice.

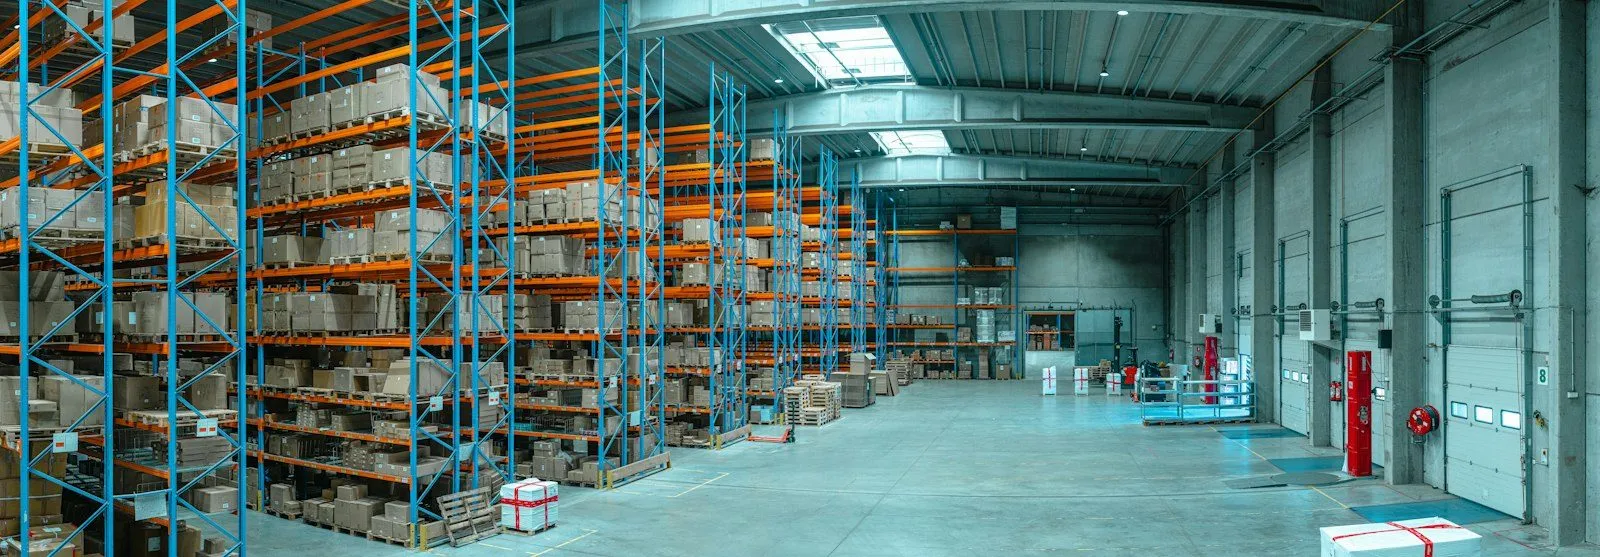
Warehouse with high racking

Works with

  • TMS
  • WMS
Situation
The same order is in the TMS and in the WMS. One typo, and the planning or the invoice is no longer correct.
What the hub does
The hub sets the data from both systems side by side and flags the discrepancies to whoever needs to correct them.
What you gain
Fewer errors and less rework. Your planners plan on data that is correct.

Driving and rest times next to the planning

HR data and driving and rest times in the same view as the transport planning.

Trailer on the motorway, seen from behind

Works with

  • HR
  • driving and rest times
  • on-board computers
  • TMS
Situation
The planning is in the TMS, the driving and rest times in another system and the personnel data with HR. Whoever plans has to put them side by side themselves.
What the hub does
The hub brings the three sources together, without anyone having to supply the data again. An AI agent flags when the planning and the driving and rest times do not match.
What you gain
HR data becomes usable in operations, without extra input. Your planner sees the complete picture in one place.

The same KPIs for every site

One dashboard with the same key figures for every site.

Diagram phase 2: KPI dashboards sit on top of the data hub, a slow loop to evaluate the past period and adjust course.Insights for youquestions in plain language, with theAI subscription you already haveData hubuser permissionsdata modelConnectorsYour systemsHR, finance, TMS, WMS, planning,PLC, SCADA, telematics …KPIdashboardsslowloop

Works with

  • TMS
  • WMS
  • fleet management
  • Power BI
Situation
Every site reports in its own way. Comparing figures takes time and discussion.
What the hub does
The hub brings the data of all sites together with the same names and definitions. On top of that we build targeted KPI dashboards. If you already use a BI tool such as Power BI, it gets the data from the hub.
What you gain
You evaluate the past period on facts and adjust course for the next. The managing director gets one reliable overall picture.

Dispatch knows straight away

If a trailer is not at the agreed location, dispatch gets a notification straight away.

Works with

  • TMS
  • trailer tracking
Situation
A driver has to leave their trailer at a secure car park. If that does not happen, you only notice when something goes wrong, such as theft of the load.
What the hub does
The TMS knows where the trailer should be, the tracking where it is. The hub sets both side by side live. If they do not match, dispatch gets a notification straight away. The dispatcher decides what happens, for example asking the driver to take the trailer to the secure car park.
What you gain
You intervene before there is an incident. You prevent a damage claim, instead of having to explain it afterwards to your customer and your insurer.

Temperature deviation in a refrigerated trailer

If the temperature in a zone of a refrigerated trailer stays above the setpoint for too long, the planner gets a notification straight away, with escalation and a report on the trip.

Works with

  • telematics
  • planning
Situation
The temperatures are in a different portal from the planning. A deviation is only seen if someone happens to look, and by then it is often too late.
What the hub does
One rule applies to every refrigerated trailer, including the trailer you add tomorrow: if the temperature in a zone stays above that zone's setpoint for too long, the hub reports the deviation and records it on the trip. Every deviation is on the timeline, with start, end and highest value.
What you gain
The planner gets a notification straight away. If the notification is not acknowledged, it escalates. For a complaint or audit the report is ready, and your customer can follow their own shipments if you wish.

Energy

One view across all portals

The data from every monitoring portal comes together in one hub, whatever the brand or year of construction.

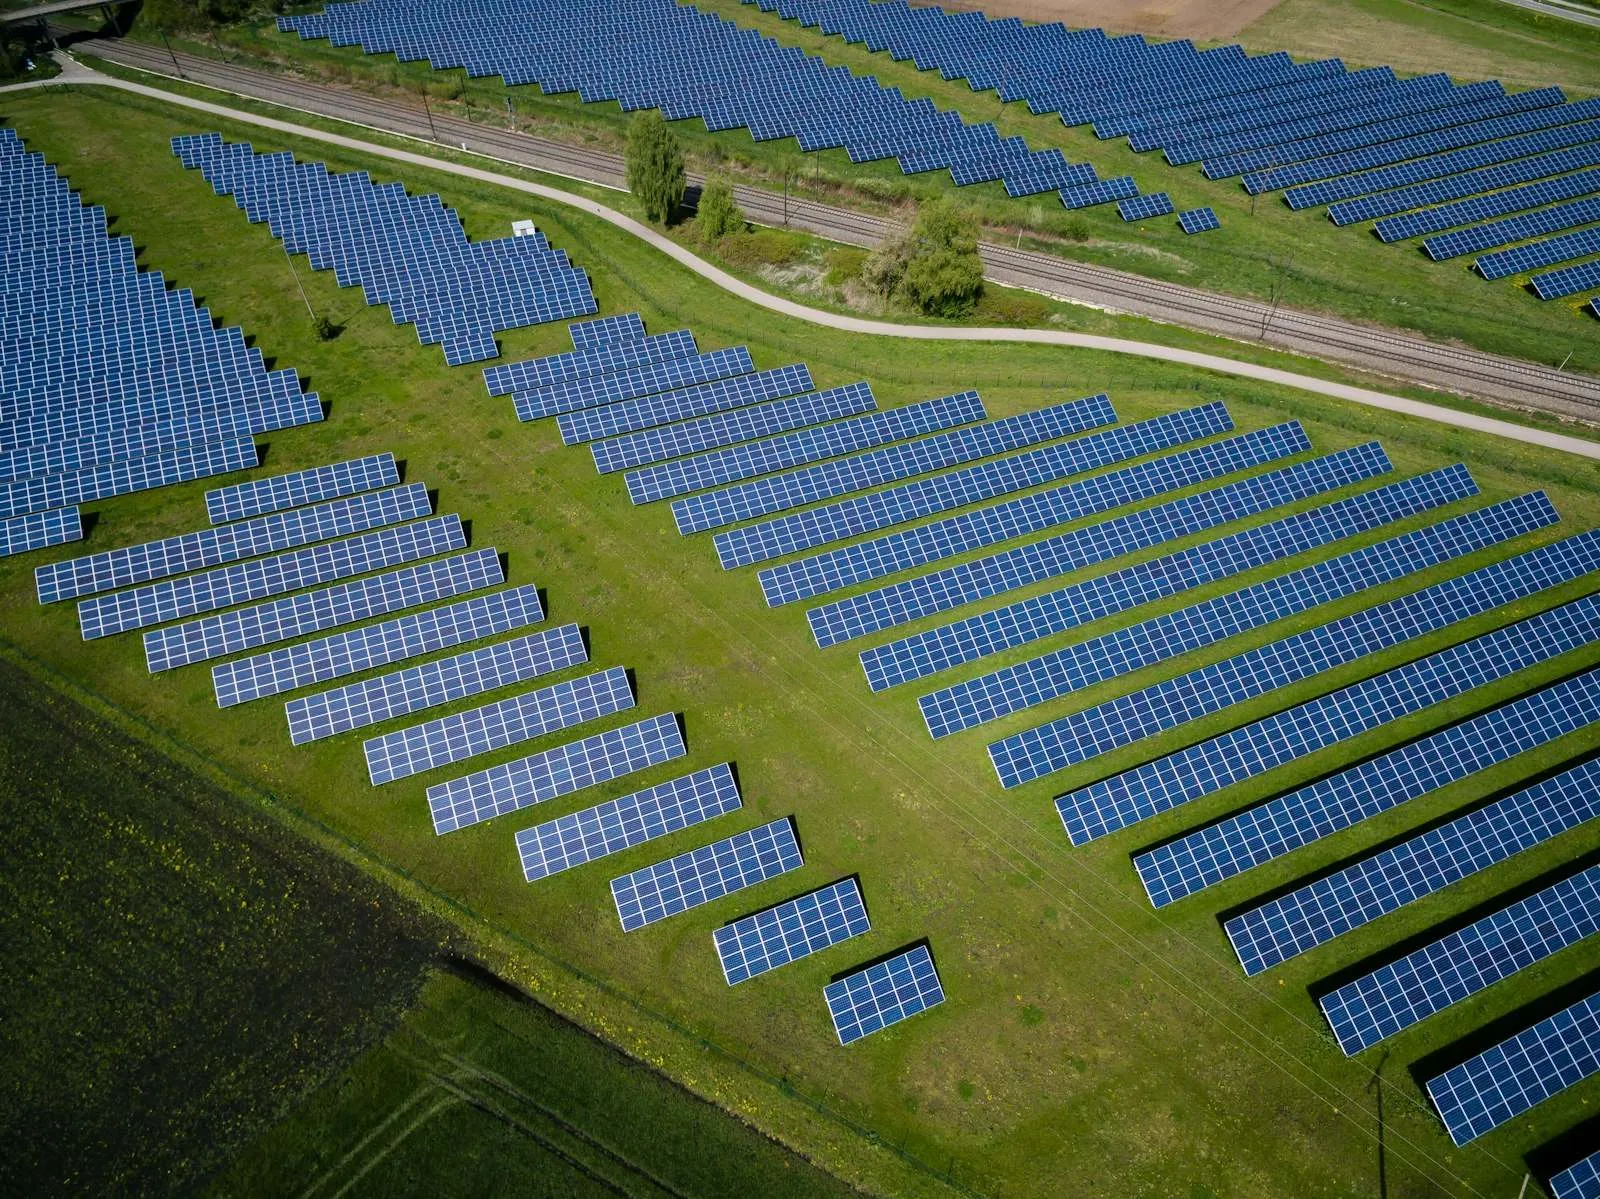
Solar park seen from above

Works with

  • monitoring portals
  • inverters
  • energy meters
  • SCADA
Situation
You inherit installations from installers and project developers, and with them their portals. Every morning someone logs in to a dozen systems to get one picture.
What the hub does
One connector per portal retrieves the data. In the hub, every data point gets a fixed name and context, so that installations of different brands become comparable. This approach is called a unified namespace.
What you gain
One screen instead of ten logins. You also set up uniform notifications for all assets, including those added in the future.

Asking questions about your whole park

You ask in plain language which installations performed below expectations. Overall Equipment Effectiveness (OEE) becomes a conversation in which the right conclusions are drawn straight away.

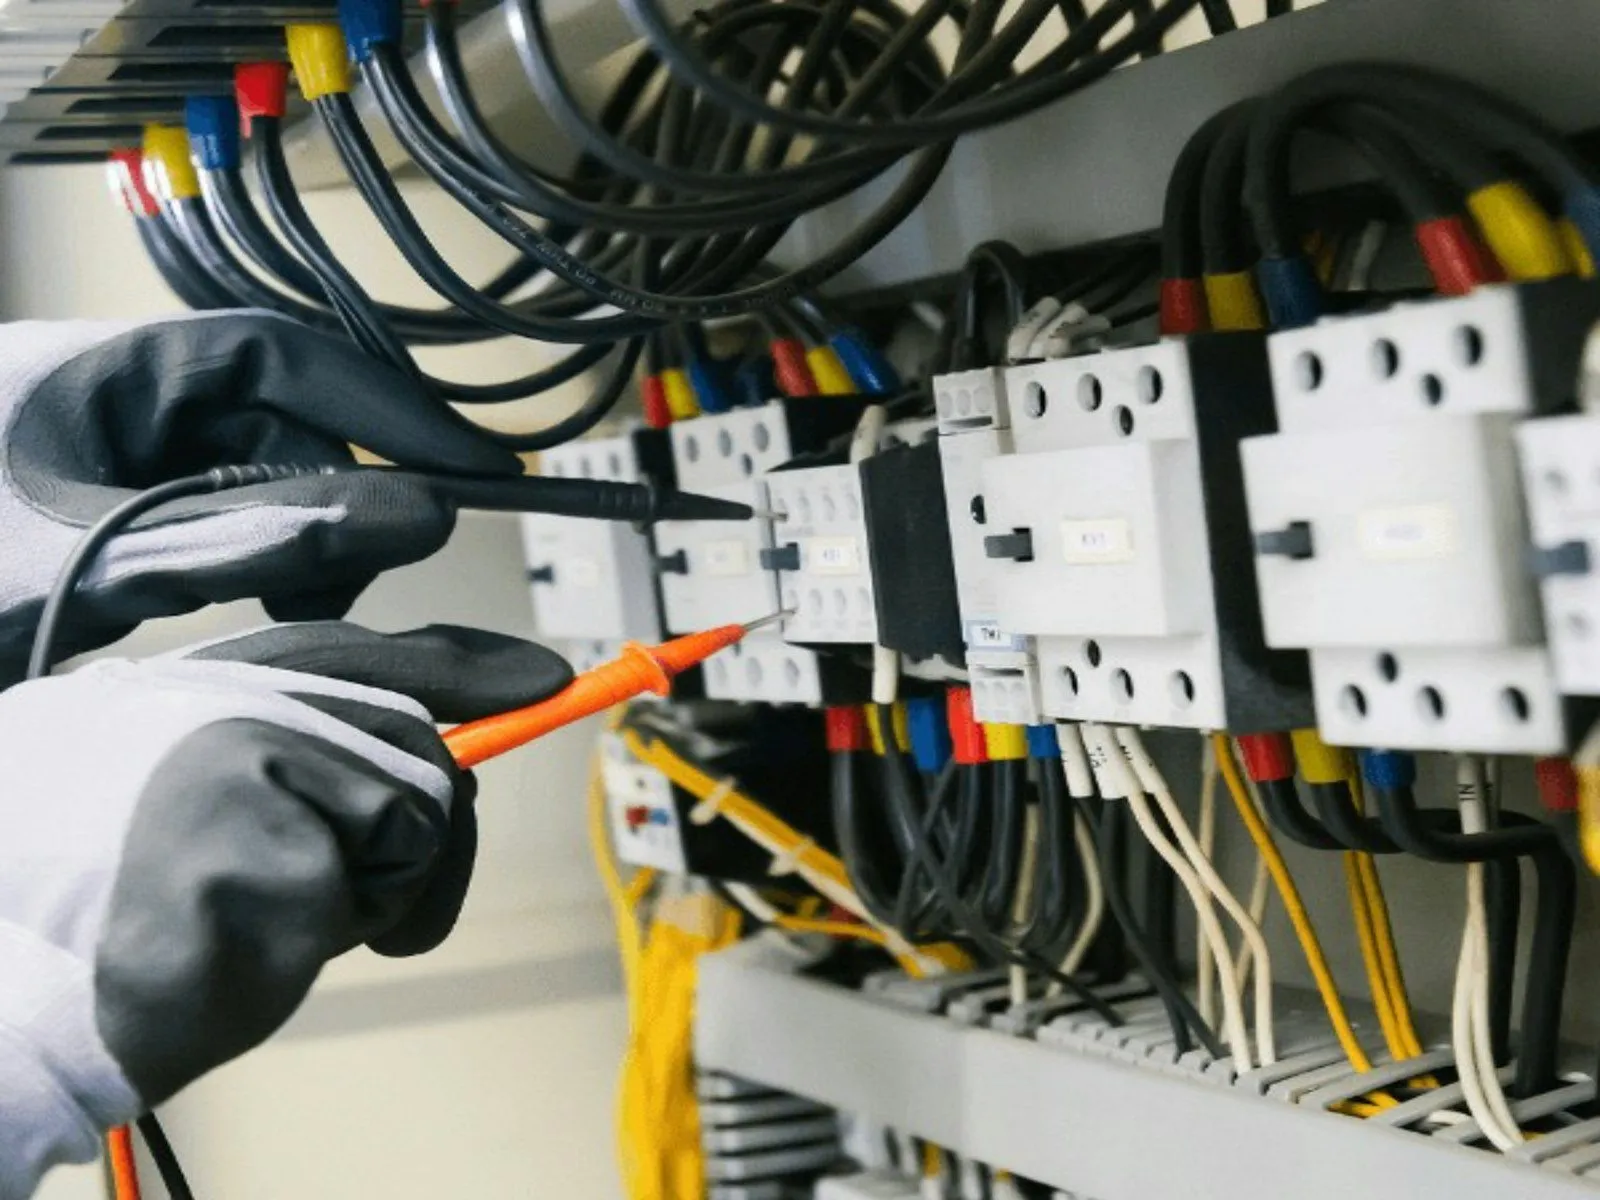
Measurement with a multimeter in a switch cabinet

Works with

  • monitoring portals
  • maintenance management
Situation
Production, faults and interventions are in different portals and lists. Answering a question about the whole park takes a lot of searching.
What the hub does
The hub stores the current and historical data of all portals and of your maintenance data. You ask your question with the AI subscription you already have.
What you gain
A fast diagnosis across all your installations. Decisions based on all the facts.

Planning, technicians and invoicing in the same view

Not only your installations, but also your technicians, planning and invoicing in one hub.

Technician with helmet and high-visibility vest in a solar park

Works with

  • monitoring portals
  • planning
  • HR
  • finance
  • contract management
Situation
A monitoring platform shows the installations. But who carries out which intervention, what the contract says and what was invoiced is somewhere else.
What the hub does
The hub brings the installation data together with your planning, your personnel data, your contracts and your invoicing. That is where a data hub differs from a monitoring platform that only shows installations.
What you gain
One overall picture of your operations, not just of your installations. For example, you see the operational improvement after maintenance or an intervention.

One reporting layer across all technologies

The same KPIs for every installation and every park, across brands.

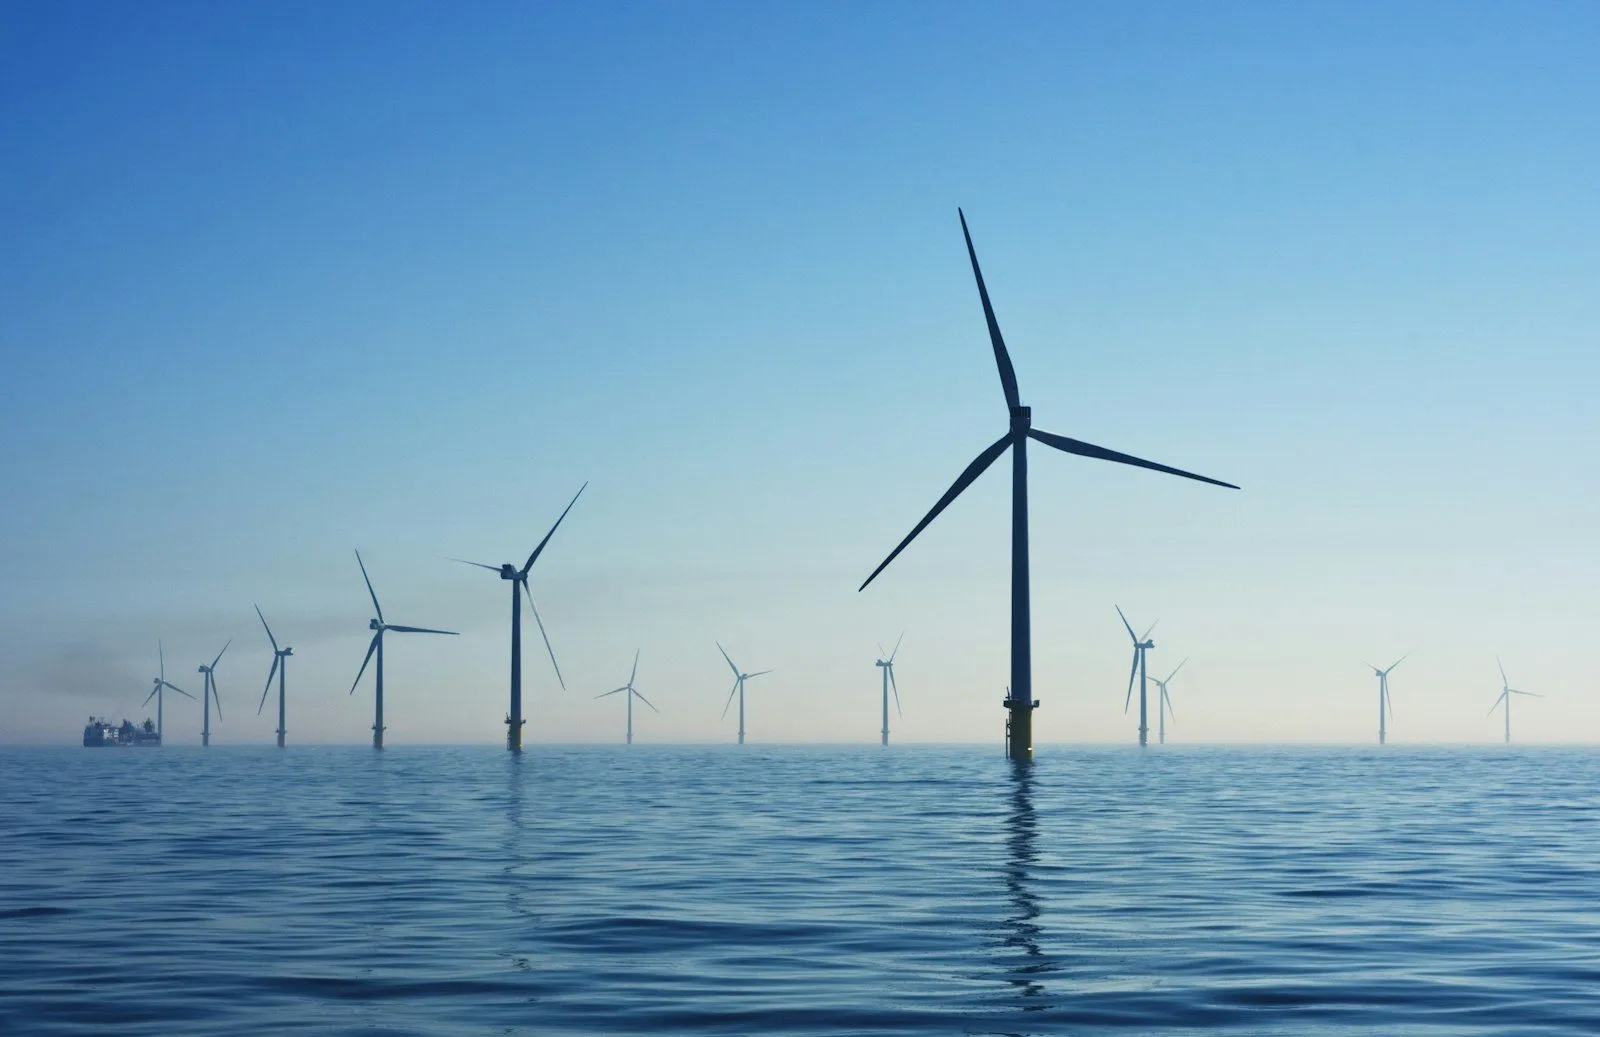
Offshore wind turbines

Works with

  • monitoring portals
  • energy meters
  • Power BI
Situation
Every portal reports in its own way. Comparing production, consumption and availability across parks is manual work.
What the hub does
On the combined data we build targeted KPI dashboards per period, for your own follow-up and for reporting to the owners of the installations. Your BI tool can use the data from the hub.
What you gain
You evaluate the past period on facts. You get one reliable overall picture across technologies. Uniform notifications make setting priorities simple.

Faults reported without logging in first

The right person gets a notification, without anyone first opening the right portal.

Works with

  • monitoring portals
  • planning
Situation
A fault goes unnoticed until someone happens to open the right portal.
What the hub does
Algorithms follow the data of all installations live. On a failure or deviation, a notification goes to whoever needs to know. Who gets which notification is agreed with you per project.
What you gain
You see a fault when it occurs, not afterwards. You adjust course while it still counts.

From fault to intervention proposal

Your planner gets an intervention proposal that they approve themselves first.

Diagram: fault signal and planning come together in the data hub, which shows a proposal on the planner's screen with an approve buttonFault signalPlanningData hubPlanner's screenProposalapprove

Works with

  • monitoring portals
  • maintenance management
  • planning
Situation
After a fault, the planner has to work out which technician is available, what is already scheduled and what the contract provides for.
What the hub does
An agent sets the fault signal next to the planning and the maintenance history and proposes an intervention. The planner approves every proposal themselves.
What you gain
Your planner can bundle and prioritise interventions based on live data. You stay at the helm.

Industry

Machine data next to orders and planning

Measurements and transactions in one hub, with one name and context per machine or order.

Diagram phase 1: connectors pull the data from your systems into one data hub, which you query with the AI subscription you already have.Insights for youquestions in plain language, with theAI subscription you already haveData hubuser permissionsdata modelConnectorsYour systemsHR, finance, TMS, WMS, planning,PLC, SCADA, telematics …

Works with

  • PLC
  • SCADA
  • ERP
  • MES
Situation
When there is a deviation on the line, nobody knows straight away which order and which customer are affected. That information is in another system.
What the hub does
Connectors pull the data from the machine control, from SCADA and from your ERP or MES. In the hub, everything gets a fixed name and context. This approach is called a unified namespace.
What you gain
When there is a deviation, you see straight away which order and which customer are affected. Fast diagnosis across systems.

Older installations in the picture too

Installations of different generations and brands connected, without replacing them.

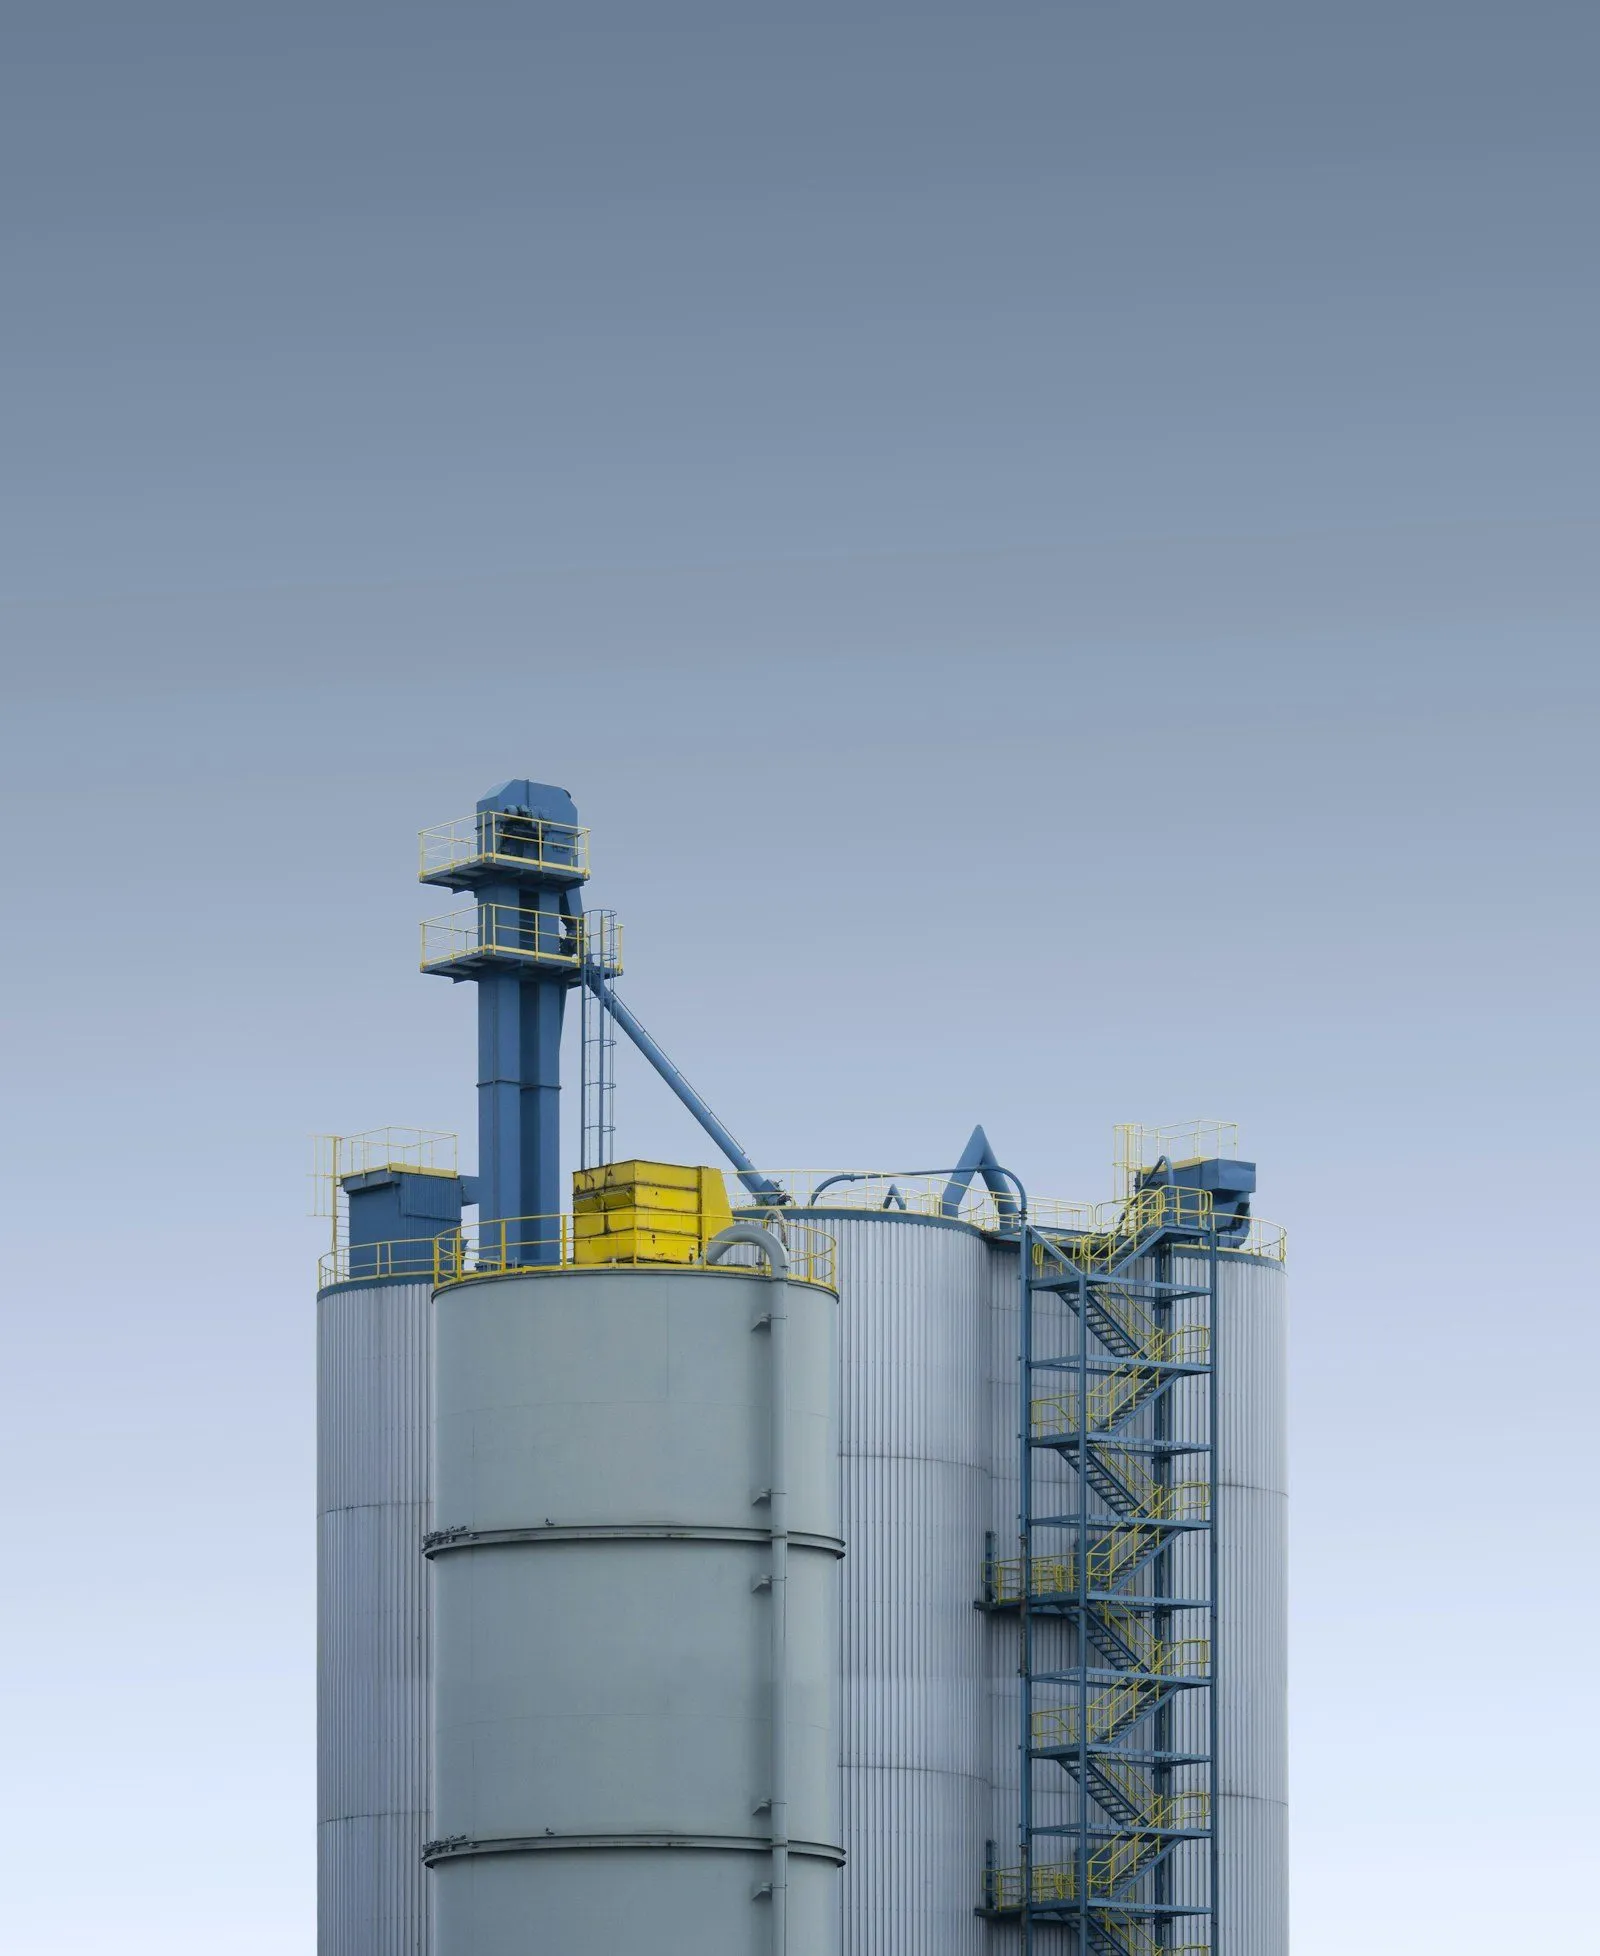
Industrial silos with an elevator and stairs

Works with

  • PLC
  • SCADA
  • existing monitoring
Situation
Alongside new lines, older installations are running, each with its own control and monitoring. They stay out of the picture.
What the hub does
For every data source we find out how to get the data out, whatever the brand or year of construction. You do not need your own IT department. We coordinate with the suppliers of software solutions and sensor systems. Every system that handles data is a potential source we connect.
What you gain
One view across all your installations, old and new. No large migration.

KPIs and OEE across lines and generations

The same key figures for old and new installations.

Diagram phase 2: KPI dashboards sit on top of the data hub, a slow loop to evaluate the past period and adjust course.Insights for youquestions in plain language, with theAI subscription you already haveData hubuser permissionsdata modelConnectorsYour systemsHR, finance, TMS, WMS, planning,PLC, SCADA, telematics …KPIdashboardsslowloop

Works with

  • PLC
  • SCADA
  • ERP
  • Power BI
Situation
Every line measures differently. Comparing OEE, the key figure for the availability, performance and quality of an installation, across lines means calculating in Excel.
What the hub does
On the combined data we build targeted KPI dashboards with the same definitions for every line. Your BI tool can use the data from the hub.
What you gain
You evaluate the past period on facts and adjust course for the next. One reliable overall picture for the managing director or operations manager.

Evaluating deviations with the history

Finding in one place which changes were made when in process, orders and planning.

Diagram: timeline with changes from different systems (orders, master data, planning), each with a timestamp08:14Orderschange10:02Master datachange13:37Planningchange

Works with

  • all connected systems
Situation
A deviation keeps coming back. To find the cause, the quality department gathers data from different systems.
What the hub does
All data is stored in the hub with a timestamp. So you see which changes were made when, even if an AI agent made them, next to the process data of that moment.
What you gain
Searching for the cause in one place, without gathering data together. A basis for tackling recurring deviations structurally.

Flagging exceptions live

The right person gets a notification while they can still adjust course.

Diagram phase 3: agents and algorithms follow the data hub live, a fast loop that adjusts course while it still counts.Insights for youquestions in plain language, with theAI subscription you already haveData hubuser permissionsdata modelConnectorsYour systemsHR, finance, TMS, WMS, planning,PLC, SCADA, telematics …KPIdashboardsslowloopAgents andalgorithmsfastloop

Works with

  • PLC
  • SCADA
  • MES
  • ERP
  • planning
Situation
A deviation only surfaces in the end-of-week report, when the damage has already been done.
What the hub does
Algorithms follow the data stream live and flag what needs attention. Who gets which notification is agreed per project. At first, your team approves every proposal. Only after a validation period, and only where possible and where we activate it together with you, can an algorithm intervene automatically.
What you gain
You adjust course during production, not afterwards. You stay in control.

Across sectors

Asking questions of your own data

You ask questions in plain language of an AI model that knows the data from all your systems.

Works with

  • all connected systems
  • your own AI subscription
Situation
An operational question that needs data from several systems stays unanswered because nobody has the time to gather everything together.
What the hub does
The hub brings the current and historical data of your systems together, with one fixed name and context per data point. You ask your question with the AI subscription you already have, within the permissions you set.
What you gain
An answer from one place. The management formulates and prioritises initiatives based on facts.

Which changes, and when

You can trace which changes were made when in transactions, master data and planning, even if an AI agent made them.

Diagram: timeline with changes from different systems (orders, master data, planning), each with a timestamp08:14Orderschange10:02Master datachange13:37Planningchange

Works with

  • all connected systems
Situation
After an incident or complaint, it is hard to reconstruct what changed when in which system. Now that AI agents also make changes, this becomes even more important.
What the hub does
All data enters the hub with a timestamp. This automatically builds a history of which changes were made when, across all your systems.
What you gain
You find the cause and can prevent it happening again. A strong basis for compliance and audits.

Discrepancies between systems stand out

The hub flags discrepancies between systems, for example caused by double entry.

Works with

  • all connected systems
Situation
The same data is entered twice, resulting in errors.
What the hub does
The hub sets the data from your systems side by side and flags the discrepancies to whoever needs to correct them. Doubtful cases go onto a task list: the AI assistant makes a proposal, a person approves it.
What you gain
Discrepancies caused by double entry become visible and can be corrected.

One live overview, whatever you monitor

Every object with its live value and status, from trailer to compressor, in one overview.

Works with

  • sensors
  • telematics
  • machines
  • planning
  • ERP
Situation
The planning is in one system, the temperatures in another portal and the rest in Excel.
What the hub does
Everything that comes in about a trailer, machine, building or field plot comes together on that object. You keep working in your own systems. The hub reads along and makes the connections.
What you gain
One overview, whatever you monitor. You see straight away what deviates.

Everyone sees what they are allowed to see

You decide per person and per object who may see, change or control what.

Works with

  • all connected systems
Situation
Planners, drivers, the quality department and your customer work with the same data, but not everyone should see everything.
What the hub does
You decide per person and per object who may see, change, control or manage what. Your people have their own portal, on PC, tablet and mobile phone.
What you gain
Your customer can follow their own shipments, if you wish. Your AI assistant, too, only sees what you yourself are allowed to see.

Every figure traceable to its source

In the hub you see, for every figure, which source and which calculation it comes from.

Works with

  • all connected systems
  • your BI tool
Situation
A figure in a report raises questions: where does it come from, and is it still correct if a source changes the past?
What the hub does
You define rules and calculations once on an object type. For every figure you see which source and which calculation it comes from. If a source changes the past, the hub recalculates the results.
What you gain
Always the same, cleaned-up figures, for everyone. Your analysts keep working with what they know.

Enter once

The input from one master system flows through to the other systems.

Diagram: the input from the master system goes via the broker to system A and system BMaster systemBrokerSystem ASystem B

Works with

  • all connected systems
  • broker
Situation
Your administration enters the same data in several systems. That takes time and leads to errors.
What the hub does
You agree which system is the master system. Via the broker, an intermediary that passes messages between systems, the input from that system also appears in the others.
What you gain
Enter data once. Less time spent on double entry, fewer errors.

Escalation if nobody responds

If a notification is not acknowledged in time, it goes to the next person or to another channel.

Works with

  • app
  • SMS
  • phone
Situation
Who was alerted and what was done is not recorded anywhere. For a complaint or audit, you piece it together afterwards.
What the hub does
When there is a deviation, the right person gets a notification. If it is not acknowledged in time, the hub escalates to the next person or to another channel. You decide who, via which channel and after how many minutes.
What you gain
Every step is recorded: who was alerted, who acknowledged and what was done. For a complaint or audit the report is ready.

One rule for your whole fleet

You set a rule once on an object type. It applies to every object of that type, including the object you add tomorrow.

Works with

  • all connected systems
Situation
Every new trailer, machine or installation requires the same settings and calculations all over again.
What the hub does
You define rules and calculations once on an object type. The hub applies them to every object of that type: live, on every new measurement, and over the history, such as deviations per trip, totals per month or trends per customer. If a source changes the past, the hub recalculates the results.
What you gain
Your fleet grows, the work does not.

Reports and exports that run by themselves

Reports, approvals, deliveries and links with your systems, set up to suit the way you work: automatically at a fixed time, or as soon as something happens.
Works with

  • all connected systems
Situation
Reports, approvals and exports to other systems are done manually today.
What the hub does
We set up the workflows to suit the way you work: automatically at a fixed time, or as soon as something happens. Remote control is also possible: a pump, a relay or a cooling unit, each time with confirmation and a log.
What you gain
What happens manually today runs by itself tomorrow.

No application for this combination. Tell us how your operations run: we will look together at what is possible.

Not ready for a call yet?

Three questions to check for yourself

  1. Do you have several software systems to manage your operations?
  2. How long does it take before you notice something is going wrong?
  3. How quickly can you reconstruct what went wrong?

Feel free to judge for yourself whether an exploratory call is worthwhile.

Next step

Shall we work out your first application together?

A worked-out Proof of Value lets you make a well-founded decision.

Book an exploratory call (opens in a new tab)

Prefer to call or email right away? Pieter Langsweirdt · +32 498 516 440 · pieter@captainsoflogic.com